Inquire
Change of age
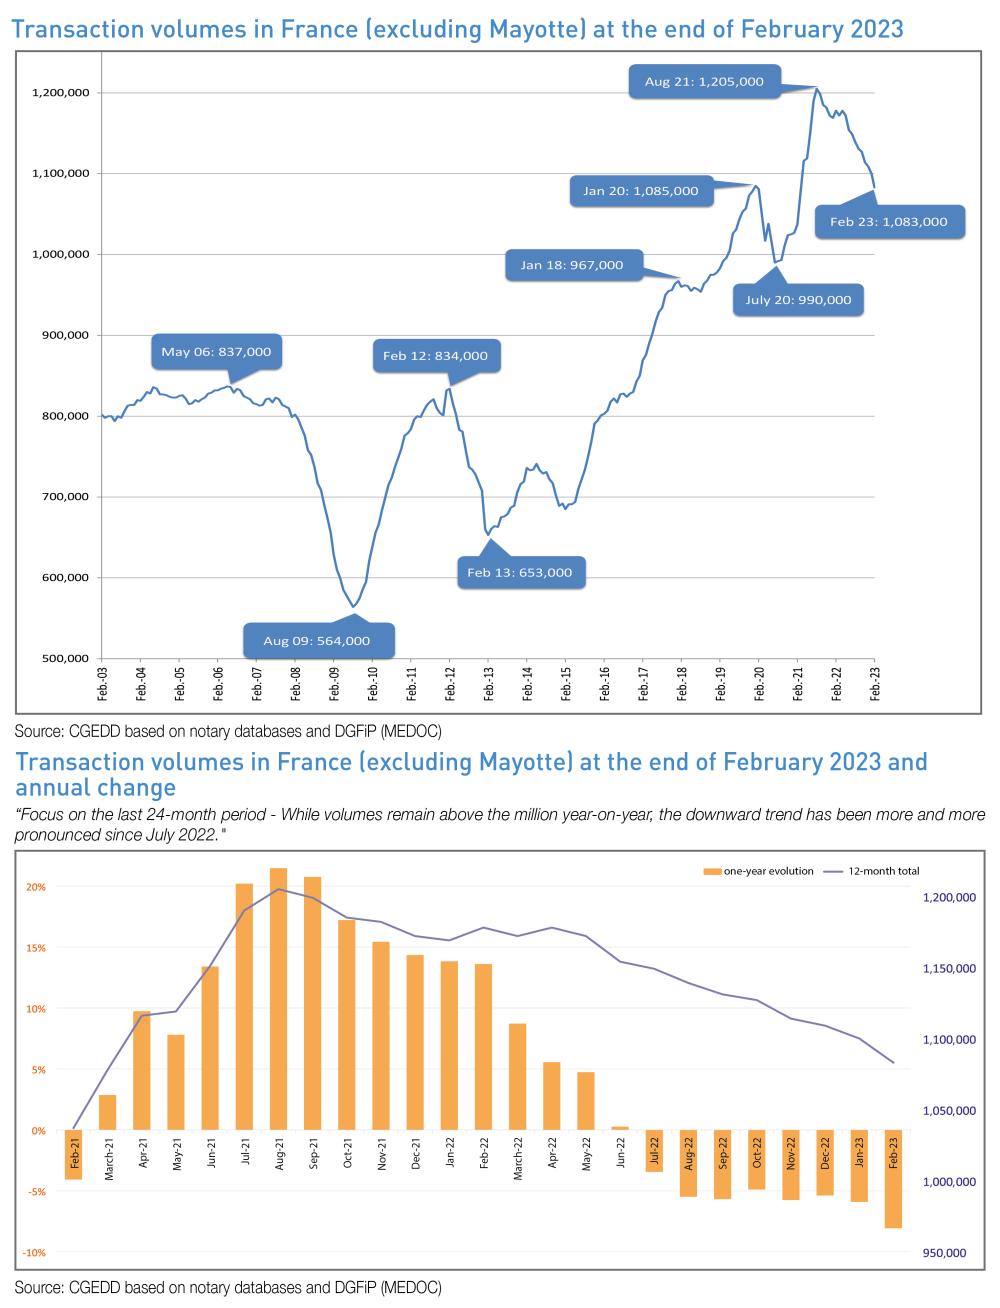
The total volume of transactions in existing homes over the last twelve months in France (excluding Mayotte) reached 14,808,000 transactions at the end of February. Since August and 2021, this volume has contracted after an extremely concentrated and exceptional bull market, returning to the level seen just before the health crisis. While the volume of transactions had entered a downward phase of around 5.5% since the summer of 2022, it now stands at -8.1% year-on-year at the end of February. The decline suddenly accelerated, reflecting the feelings of notaries at a deeply calm start to the year. At this rate, the volume of transactions could fall below the million mark at the end of the summer. It is usual to believe that the real estate year is determined in the spring. This assertion is likely to prove to be wrong in light of the infl ationary environment and the rise in interest rates, which is impacting the real estate market, correlated to a new market in the midst of a slump with no current prospect of a recovery. It should also be noted that, in this context, there is also the compulsory energy renovation of housing, for which fi nancing may be questioned.
Image (1000*yyy)

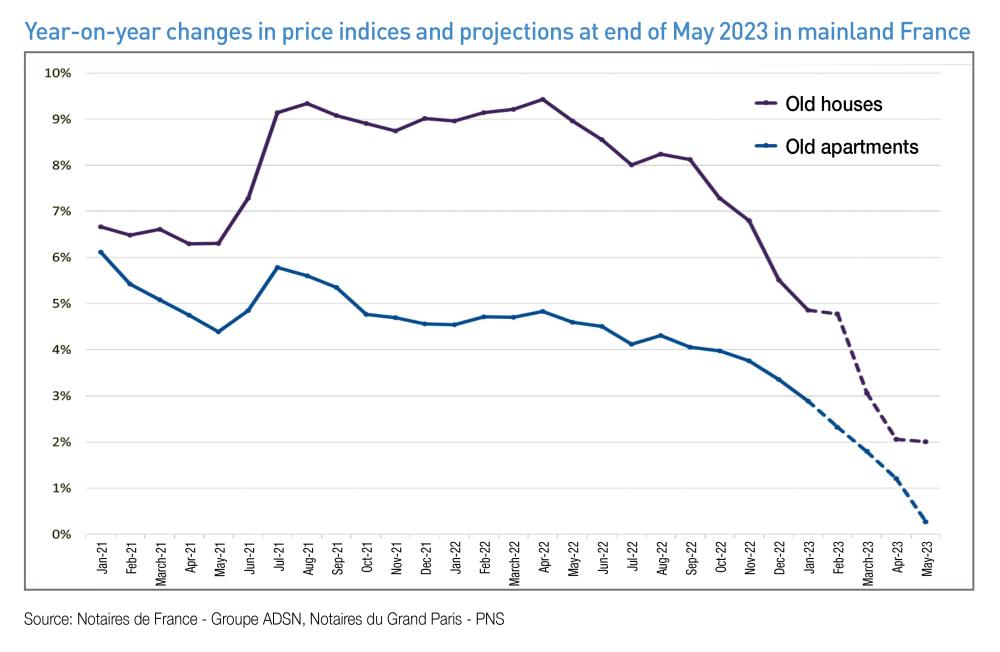
Furthermore, the downward trend in volumes suggested a future drop in prices. While it has not materialised yet, according to the projections from preliminary contracts at the end of May 2023 in terms of year-on-year change, prices of existing homes in metropolitan France would undergo a significant change in trend: after the gradual deceleration in the price increase observed since September 2022, prices would be only slightly higher at the end of May (+1.3% year-on-year). The annual changes recorded on the individual customers market would then be +2% vs. +0.3% for the collective sector, suggesting a decline in the future.
However, it is worth noting that changes in price indices over three months show a drop of -0.9% at the end of May 2023, both in individual and collective terms.
Image (1000*yyy)

More specifically, in the provinces, the rise in the prices of existing homes recorded would also see a gradual deceleration. After recording an
annual increase of +6% in Q4 of 2022, prices are expected to increase by only +2.4% year-onyear at the end of May 2023. The rises would be similar on the individual market (2.3%) and on the collective market (+2.5%). In Ile-de-France yearon-year, from January 2022 to January 2023, the prices of existing homes increased by +1%. While those of apartments has stabilised, the home market is still up +2.7%. However, the yearon-year change, which takes into account price increases until August 2022, still masks the fact that prices have fallen since September 2022, for the fourth consecutive month. Leading indicators on preliminary contracts confirm that these price adjustments are expected to continue, in line with the decline in sales volumes. In Paris, the price per m² of old apartments was €10,410 in January 2023 (-1.6% in one year). It is expected to fall to €10,250/m² in May 2023, increasing an annual decline of -2.7%. This trend is becoming more widespread and prices are expected to fall by -3.4% in the Petite Couronne and -1.2% in the Grande Couronne from May 2022 to May 2023.
There were no annual declines in apartment prices for seven years. In one year and despite the sharp increases during the summer of 2022, prices of old homes are expected to stabilise at +0.2%.
Beyond the expected landing, the real estate market now seems to have entered a new era, in a rising trend in mortgage lending rates coupled with inflation that central banks are keeping under control by raising their interest rates, which de facto penalises borrowers. As such, the High Council for Financial Stability (HCSF) could ease its rules on the maximum debt ratio of 35% and loan terms that cannot exceed 25 years, despite the reluctance of the Banque de France, as the end of accommodative monetary policies led to a mechanical increase in interest rates, as the downturn in the real estate market is unrelated to prudential rules.
In this context, we must take into account the allocation of expenses for individuals, particularly with regard to housing and acquisition, especially for first-time home buyers. As notaries observe, first-time buyers of the most modest incomes are directly affected by this macroeconomic context, which penalises them and who, for the most part, have disappeared from the real estate market. Let us assume that if the decline in prices catalyses under the effect of a more favourable framework for buyers, the real estate market could return to a welcome second breath, with the stone in itself remaining secure against inflation.
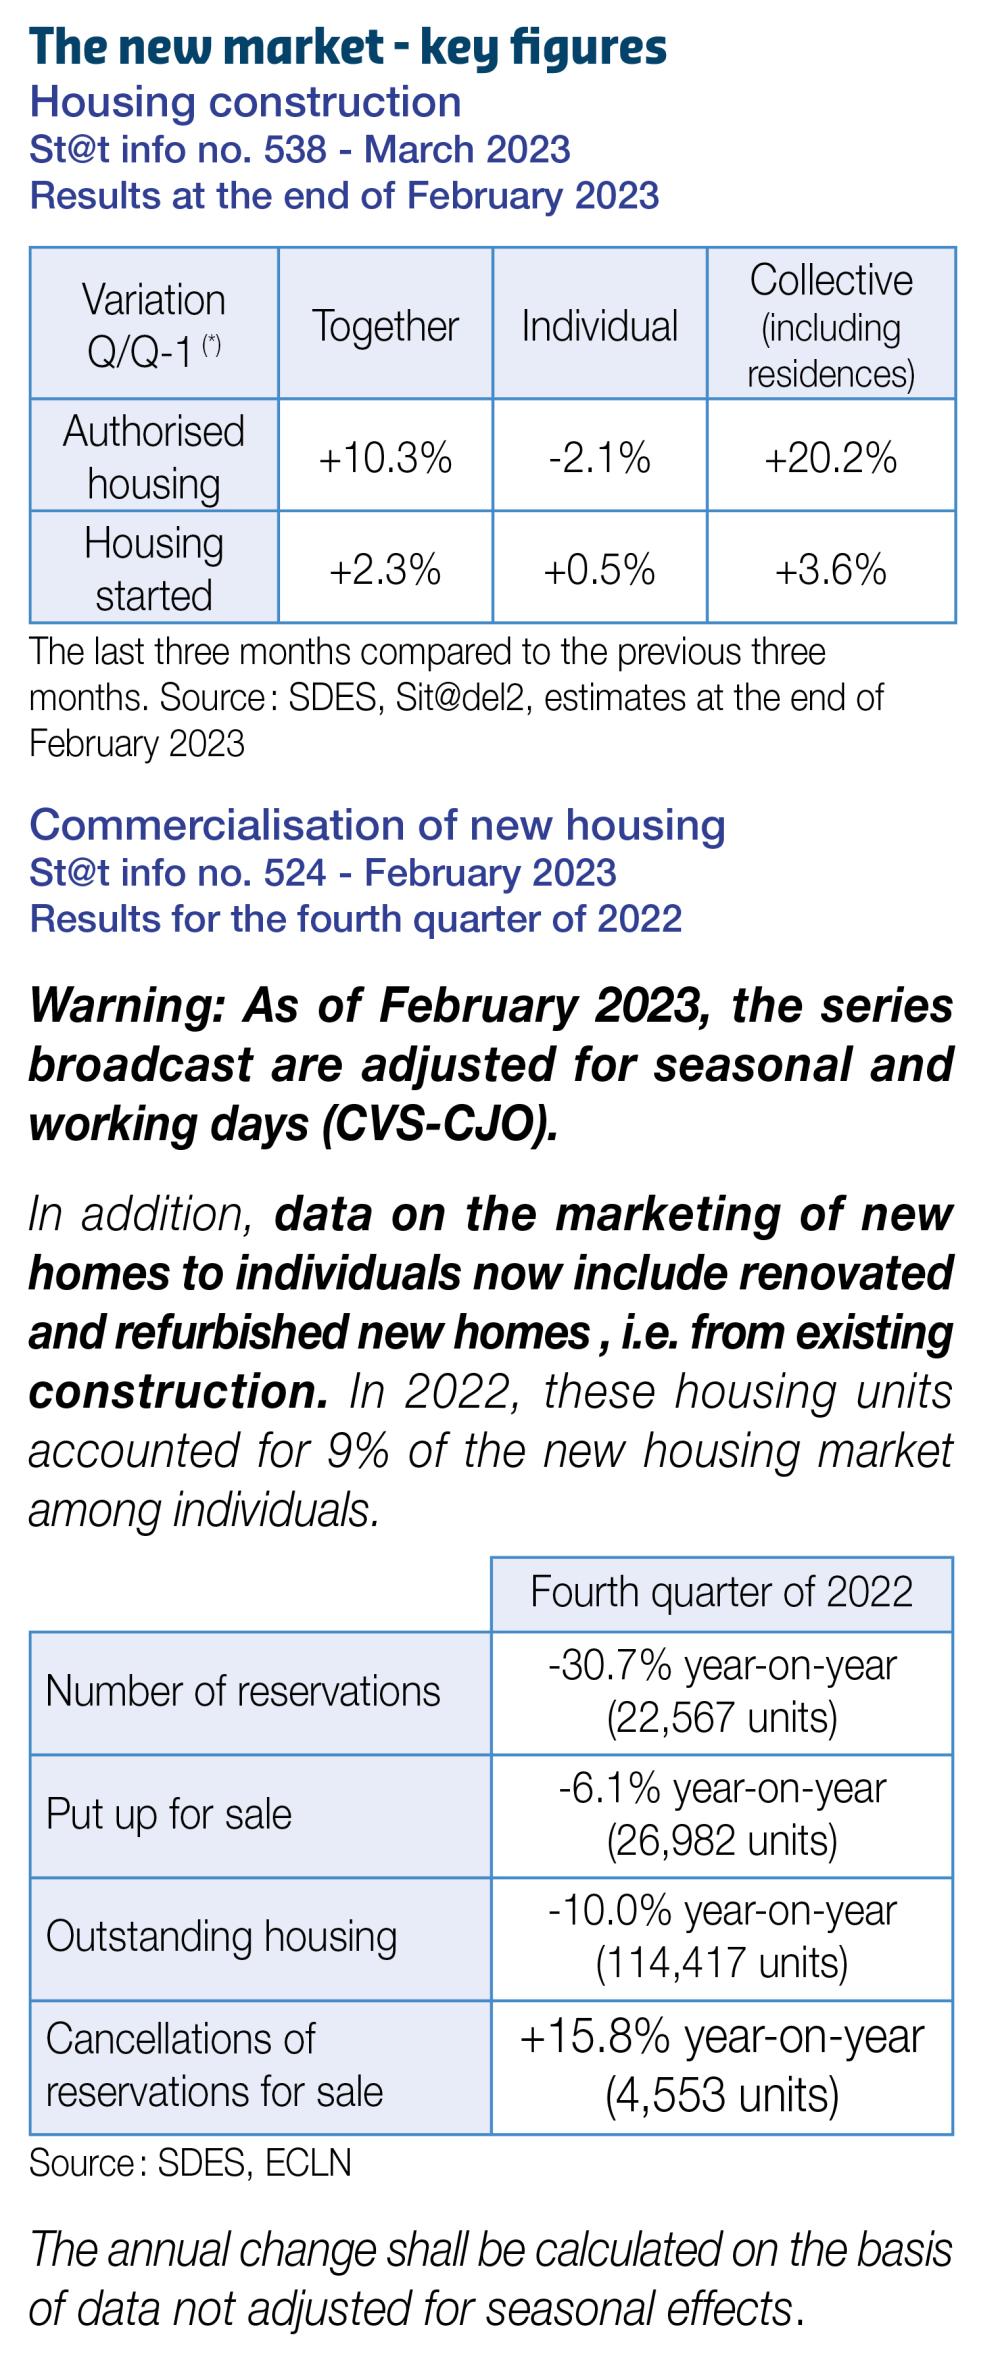
Meanwhile, the new-build market continues to sink into the crisis, leading to the shared concern of all real estate players. The French Building Federation (FFB) even described the last quarter of 2022 in the new home market as a scattered sector, with its 38% regression, as "the worst year of last sixteen years".1
The rise in building costs, linked to inflation and particularly the increase in raw materials, new environmental standards, and the scarcity of land driven by the Net Zero Artificialisation (ZAN) set for 2050, not to mention the gradual loss of attractiveness of the Pinel scheme, have led the new market to an economic impasse.
1 - Press release of the FFB Habitat Division dated 23 February 2023.
The new market - fey figures
Image (1000*yyy)

Changes in the prices of existing properties according to the A, B, C zoning
End of 2020 marked a break in price trends depending on the region
The ABC zoning1 was created in 2003 as part of the rental investment scheme known as "Robien". Although it was overhauled several times until 2014, it is used in particular for eligibility and the scales applicable to aid for rental investment and home ownership.
Housing prices are partly the result of a balance between supply and demand. The adequacy or imbalance between housing supply and demand defines the level of tension on the property market in the territory. This tension is measured through territorial dynamics as well as indicators including property prices in particular. In practice, the “ABC zoning” allows for a "classification of municipalities in the national territory into geographical areas according to the imbalance between the supply and demand for housing" in descending order of tension on the real estate market.
The imbalance is therefore greater in the Abis, A and B1 zones, whereas zone C is known to be "not stressed"2:
- the Abis and A zones: Paris, a large part of the Ile-de-France region, the Côte
- d'Azur and the border zone with Switzerland;
- the B1 zone: other large conurbations with more than 250,000 inhabitants;
- the B2 zone: other towns with more than 50,000 inhabitants;
- zone C: the rest of the territory.
The notaries of France, in partnership with INSEE, wanted to produce Notaires-Insee indices of the prices of old homes by zone of “real estate stress”, called indices by administrative area.
The analysis below shows the changes inthese 2016 series (with the resumption of price increases) to 2022, during a period marked in particular by the health crisis in 2020.
Image (1000*yyy)

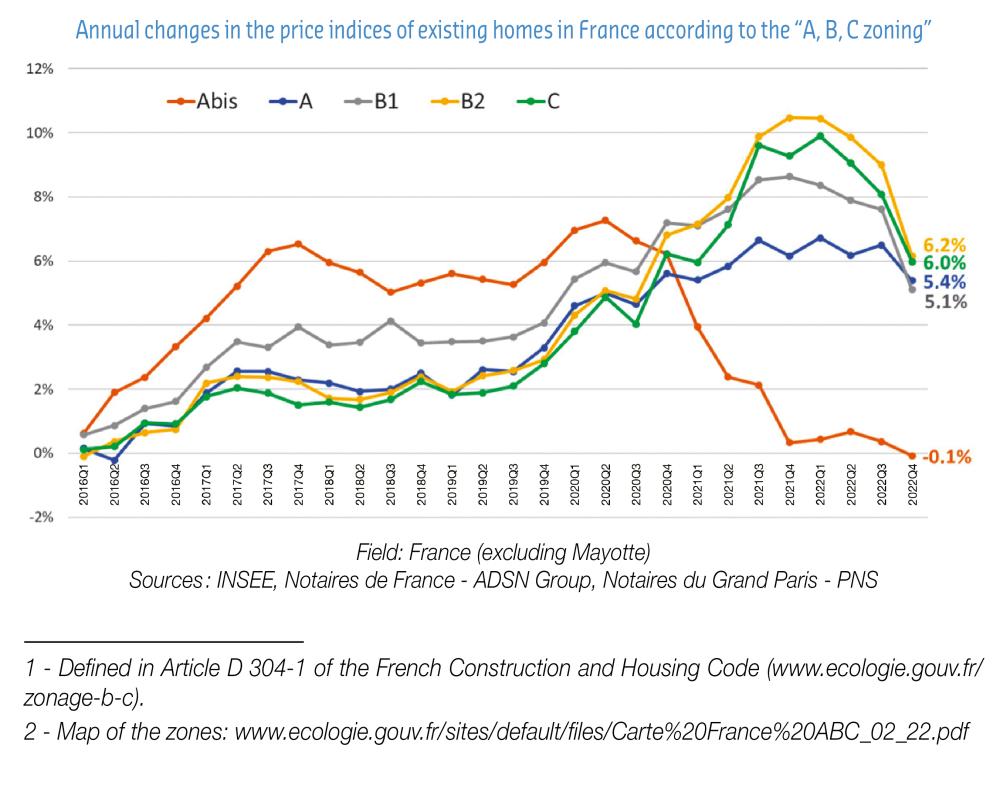
Since 2016 and until the third quarter of 2020, the annual increases in the prices of existing homes recorded in the different areas of "stress" in the real estate market follow the same hierarchy.
- the biggest rises are recorded in the most "stressed" zone Abis;
- increases are more moderate in zone B1, but remain higher than those observed in the other territories (A, B2 and C);
- in Abis and B1 zones, the prices of existing homes are rising more and more quickly until the second quarter of 2020, with up to +7.3% year-on-year in the Abis zone and +6% in the B1 zone;
- the A, B2 and C zones show similar positive annual trends with each other, but of a lesser extent. From the first quarterof 2016 to the second quarter of 2020, prices gained an average of +2% per year vs. +3% in the B1 zone and +5% in the Abis zone.
After the third quarter of 2020 marked by the health crisis, this hierarchy observed for several years changed in Q4 of 2020.
While the rise in prices is decelerating significantly in the Abis zone, they continue to grow more and more rapidly in the rest of the country until the third quarter of 2021. Moreover, increases are becoming more significant in less stressed territories. From the fourth quarter of 2020 to the fourth quarter of 2022, prices increased by an average of +2% year-on-year in the Abis zone, +6% in zone A, and around +8% in B1, B2 and C zones.
In Q4 2022, with the exception of the Abis zone, which recorded stable prices, prices rose less rapidly throughout the country. However, the rises are still slightly higher in the less “stressed” zones B2 and C (+6.1%) than in the more “stressed” zones A and B1 (+5%).